Displaying BMP180 Temperature as a Bar Graph on LCD
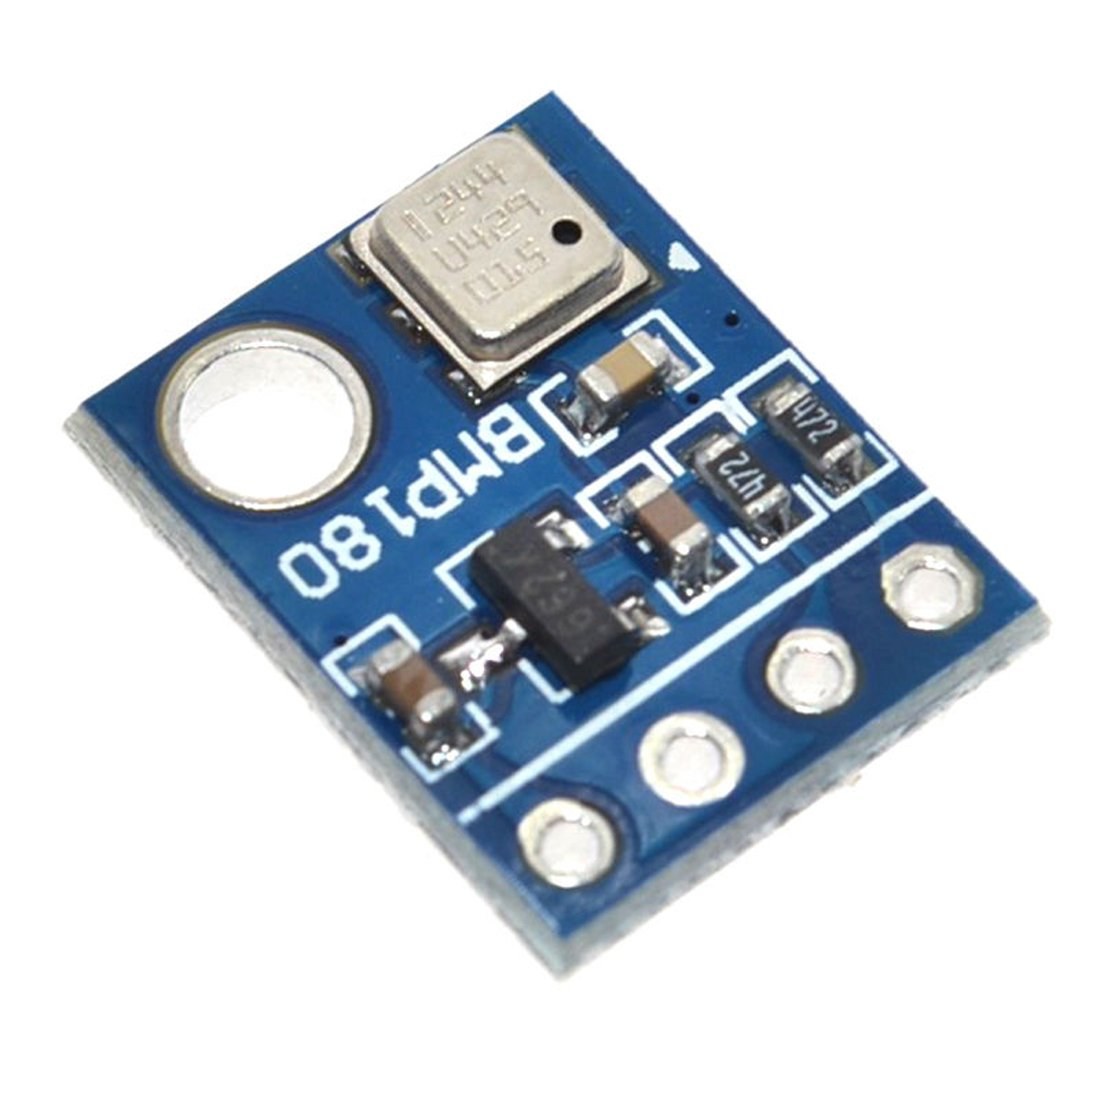
Displaying temperature as a bar graph on an LCD screen is a practical way to make data readable at a glance, especially from a distance. Instead of squinting at a numerical value, a bar graph gives you an immediate visual representation of the current temperature relative to a defined maximum. This project combines a BMP180 barometric pressure and temperature sensor with a 16x2 I2C LCD to create a clear, proportional temperature display. The bar graph fills up as the temperature rises, and when the reading exceeds your set maximum, the display switches to show "Max" to prevent overflow.
This setup is perfect for a variety of applications where quick visual feedback is more important than precise numbers:
- Building a visual room thermometer for a home or office.
- Creating a temperature monitor for a reptile enclosure or plant terrarium.
- Displaying the temperature of a 3D printer or CNC machine's control board.
- Making a simple weather station with an at-a-glance temperature readout.
- Adding a visual temperature gauge to a custom PC build or audio amplifier.
This guide will walk you through wiring the sensor and display, configuring the provided code, and understanding how to customize it for your own projects. This tutorial assumes you are familiar with the basics of the BMP180 sensor and the I2C LCD module, as it focuses on combining them with a bar graph library.
Hardware Required
- Arduino Uno (or similar board)
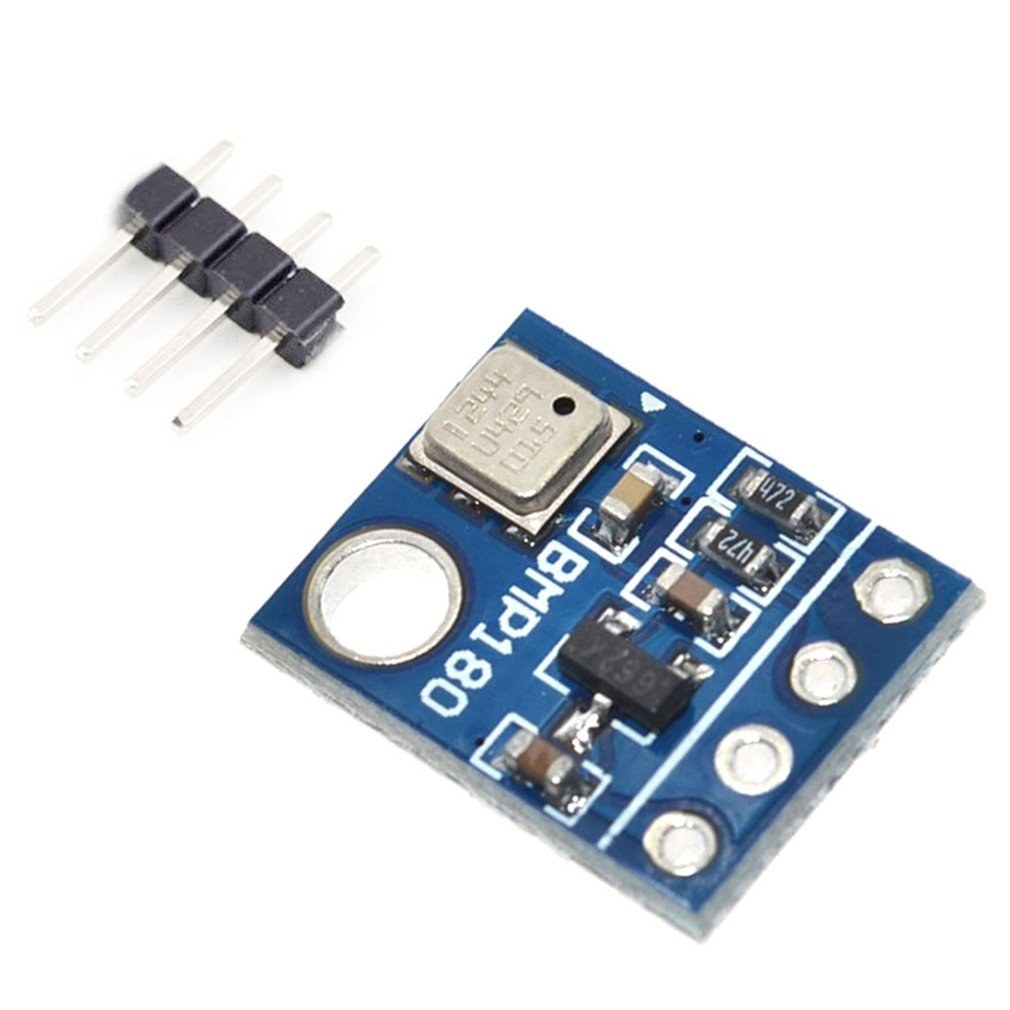
- BMP180 Barometric Pressure/Temperature Sensor
- 16x2 LCD with I2C module
- Jumper wires
- Breadboard (optional)
Wiring Guide
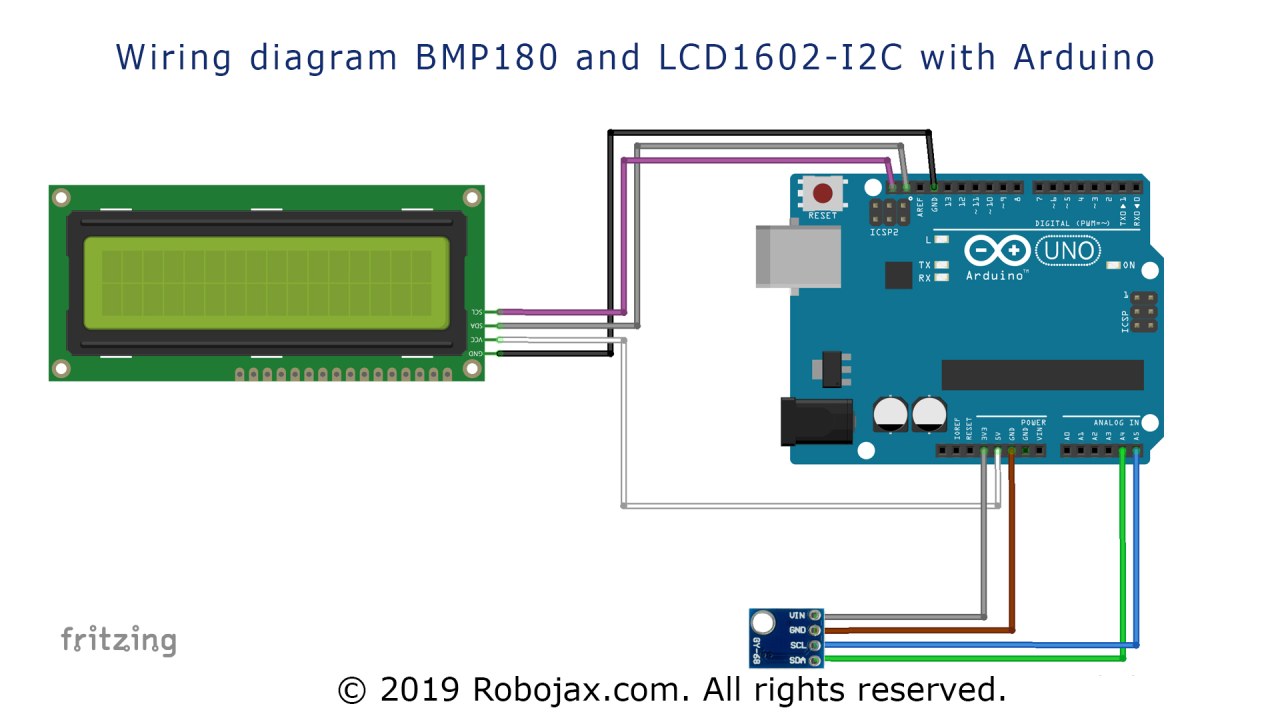
This project uses the I2C protocol for both the LCD and the BMP180 sensor, which simplifies the wiring significantly. Both devices connect to the same two data lines and power rails. The wiring is straightforward, and the color-coded connections below match the demonstration in the video.
First, connect the LCD module. The I2C backpack on the LCD has four pins: VCC, GND, SDA, and SCL.
- LCD VCC (white wire) to Arduino 5V
- LCD GND to Arduino GND
- LCD SDA (gray wire) to Arduino A4 (SDA pin)
- LCD SCL (pink wire) to Arduino A5 (SCL pin)
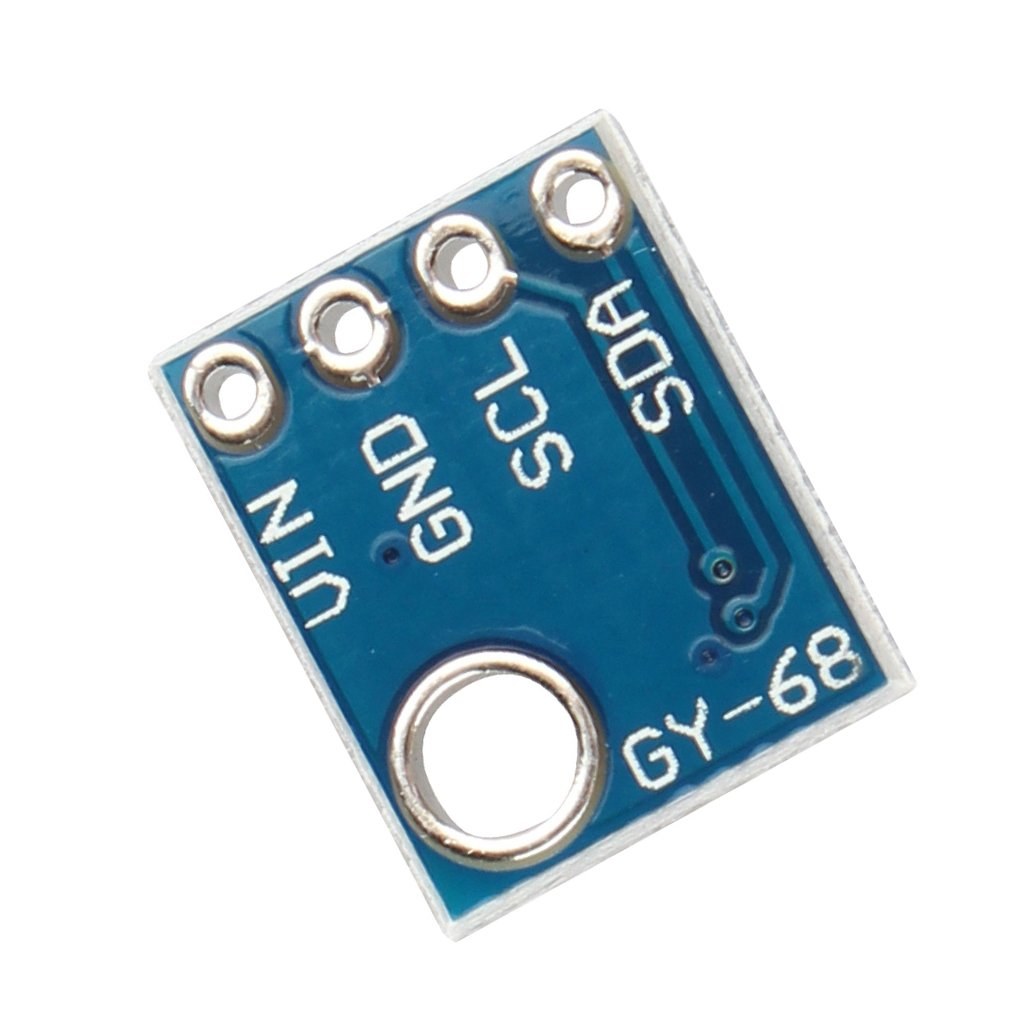
Next, connect the BMP180 sensor. It is critical to note that this sensor is not 5V tolerant on its VIN pin and must be powered from the 3.3V rail.
- BMP180 VIN (gray wire) to Arduino 3.3V (WARNING: Do not connect to 5V or the sensor will be damaged!)
- BMP180 GND (purple wire) to Arduino GND
- BMP180 SDA (green wire) to Arduino A4 (SDA pin)
- BMP180 SCL (blue wire) to Arduino A5 (SCL pin)
Since both devices are on the same I2C bus, you can connect their SDA and SCL pins to the same Arduino pins (A4 and A5, respectively).
Code Explanation
The code is designed to be easily configurable. The key settings are all located at the top of the sketch, allowing you to adjust the behavior without digging into the core logic. Here are the main parameters you can change:
#define UNIT 'C' // unit type C for Celsius F for Fahrenheit
#define maxTemperature 40 // is the value in Celsius or Fahrenheit set in line above
These two lines control the unit and scale of your display. The UNIT constant accepts either a capital 'C' for Celsius or a capital 'F' for Fahrenheit. The maxTemperature value defines the upper limit of your bar graph. For example, if you set this to 50 and the unit is Celsius, then 25°C will appear as a half-filled bar, and 50°C will fill it completely. If the temperature goes above this value, the display will show "Max" instead of a graph. (in video at 05:49)
LiquidCrystal_I2C lcd(0x3f,lcdNumCols,lcdLine); //0x3f is address for I2CThis line initializes the LCD. The 0x3f is the I2C address of your specific LCD module. This address can vary between manufacturers. To find yours, you can run an I2C scanner sketch, which is often included with the LCD library or available online. Simply upload the scanner, open the Serial Monitor, and it will report the address of any connected I2C devices. (in video at 07:13)
LcdBarGraphRobojax robojax(&lcd, 16, 0, 0); // -- creating 16 character long bargraph starting at char 0 of line 0 (see video)This line configures the bar graph itself. The first parameter (&lcd) passes a reference to your LCD object. The second parameter (16) is the length of the bar graph in characters. The third and fourth parameters (0, 0) define the starting position: the first 0 is the column (character position), and the second 0 is the row (line). To place the graph on the second line, you would change the last value to 1. (in video at 09:24)
There is also a custom function called getTemp() in the code. This function handles the communication with the BMP180 sensor. It reads the temperature, converts it to Fahrenheit if you have set UNIT to 'F', and returns the value. If the sensor fails to communicate, the function returns 999 as an error code, which the main loop checks for and displays an "Error" message on the LCD. (in video at 15:31)
Live Project Demonstration
In the video, the project is demonstrated using a heat gun. When the heat gun is blown onto the BMP180 sensor, the temperature reading on the LCD increases. As the temperature climbs, the bar graph visually fills up proportionally. When the temperature exceeds the defined maximum (50°C in the demo), the bar graph disappears and the display shows "Max" along with the actual temperature reading. Once the heat source is removed and the temperature drops back below the maximum, the bar graph reappears and functions normally again. This clearly shows how the graph scales with temperature and how the "Max" overflow protection works. (in video at 17:34)
You can also change the unit to Fahrenheit by setting #define UNIT 'F' and adjusting the maxTemperature accordingly. The demonstration shows that with a maximum of 100°F, the display works just as effectively, showing the temperature and bar graph in the selected unit.
Chapters
- [00:00] Introduction to displaying BMP180 temperature as a bar graph
- [00:43] Why use a bar graph for temperature display
- [02:34] Wiring the LCD and BMP180 sensor
- [03:34] Explaining the code and required libraries
- [07:13] Finding the I2C address of your LCD
- [09:24] Configuring the bar graph position and length
- [15:31] Understanding the getTemp() function
- [17:34] Live demonstration with a heat gun
Images

/* Display temperature from BMP180 as bargraph on LCD
 *  Original Sources:
 *  BMP180 library from https://www.sparkfun.com/products/11824
 *  LCD library: https://github.com/fdebrabander/Arduino-LiquidCrystal-I2C-library
 *  Bargraph library from https://playground.arduino.cc/Code/LcdBarGraph/
 *
 *
 *  Written and updated by Ahmad Shamshiri on June 05, 2019
 *  for Robojax in Ajax, Ontario
  Watch video tutorial for this code: https://youtu.be/0IojNYgDD7U
  If you need the schematic diagram of this circuit, please visit  http://bit.ly/rj-udemy

* Robojax Arduino Course on Udemy where you get the schematic diagram of this sketch
 * and many other robotics-related lectures and codes. Purchase the course here: http://bit.ly/rj-udemy


- (GND) to GND
+ (VDD) to 3.3V

(WARNING: Do not connect + to 5V or the sensor will be damaged!)

*/

#include <SFE_BMP180.h>
#include <Wire.h>


SFE_BMP180 rjt;// creating object called "rjt" (robojax temperature)
#define UNIT 'C' // unit type C for Celsius F for Fahrenheit
#define maxTemperature 40 // is the value in Celsius or Fahrenheit set in line above

// LCD settings
#include <LiquidCrystal_I2C.h>
byte lcdNumCols = 16; // -- number of columns in the LCD
byte lcdLine = 2; // -- number of lines in the LCD

LiquidCrystal_I2C lcd(0x3f,lcdNumCols,lcdLine); //0x3f is address for I2C
                  // to get I2C address, run I2C Scanner.
                  //Link is provided (in same page as this code) at http://robojax.com/learn/arduino
// bargraph settings
#include <LcdBarGraphRobojax.h>
LcdBarGraphRobojax robojax(&lcd, 16, 0, 0);  // -- creating 16 character long bargraph starting at char 0 of line 0 (see video)


void setup()
{
  Serial.begin(9600);//initialize serial monitor
 // -- initializing the LCD
  lcd.begin();
  lcd.clear();
  lcd.print("Robojax");


  // Initialize the sensor (it is important to get calibration values stored on the device).

  if (rjt.begin())
  {
   lcd.setCursor (0,1); //
    lcd.print("BMP180 Bargraph");
  }else {
    lcd.setCursor (0,1); //
    lcd.print("BMP180 Failed");
    while(1); // Pause forever.
  }
  // -- give use some time to read the text above
  delay(2000);
  lcd.clear();
}// setup

void loop()
{
 // Robojax BMP180 Bargraph main loop

 robojax.clearLine(1);// clear line 1 to display fresh temperature
 float T = getTemp();// get the temperature
 float Tgraph=T;
 if(T !=999){
     if( Tgraph > maxTemperature){
        Tgraph =0;
     }
        robojax.drawValue( Tgraph, maxTemperature);// draw the bargraph
      // Print out the measurement:
      Serial.print("temperature: ");
      Serial.print(T,2);


      lcd.setCursor (0,1); //
      if(T< maxTemperature){
       lcd.print("Temp.:");
      }else{
       lcd.print("Max.:");
      }
      lcd.setCursor (7,1); //
      lcd.print(T); // print
      lcd.print((char)223);// prints degree symbol
      if(UNIT =='C'){
        lcd.print("C");//
        Serial.println(" deg C");
      }else{
        lcd.print("F");
        Serial.println(" deg F");
      }


  }else{
    Serial.print("Status error");
      lcd.setCursor (0,1); //
      lcd.print("Error ");
  }

delay(500);
}


/*
 *
 * @brief gets the temperature in Celsius or Fahrenheit
 * @param unit, should be capital C or capital F, C=Celsius F=Fahrenheit
 * @return temperature in Celsius or Fahrenheit
 * Written by Ahmad Shamshiri for Robojax.com
 * on Wednesday, June 5th, 2019 at 22:30 in Ajax, Ontario, Canada
 *
 */
 ////////////////////////////////////////////
double getTemp(){
    char status;
  double Temp,newTemp;

status = rjt.startTemperature();
  if (status != 0)
  {
    // Wait for the measurement to complete:
    delay(status);

    // Retrieve the completed temperature measurement:
    // Note that the measurement is stored in the variable T.
    // Function returns 1 if successful, 0 if failure.

    status = rjt.getTemperature(Temp);
    if (status != 0)
    {
      if (UNIT =='F')
      {
        newTemp = (9.0/5.0)*Temp+32.0;// convert to degrees Fahrenheit
      }else{
        newTemp = Temp;// keeps degree Celsius
      }
    }
    return newTemp;
  }else{
    return 999;// if error, then return 999
  }
}//getTemp/////////////////////////////
Things you might need
-
AmazonPurchase BMP180 from Amazonamzn.to
Resources & references
-
ExternalBMP180 datasheet (PDF)cdn-shop.adafruit.com
-
ExternalIntroduction to the BMP180 sensoryoutube.com
-
ExternalProduct details from the manufacturerbosch-sensortec.com
-
ExternalSparkFun BMP180 librarygithub.com
Files📁
Arduino Libraries (zip)
-
Robojax LCD Bargraph Library (ZIP file)
robojax-LCD-bargraph-Library.zip0.10 MB